Discover 5 Essential Google Analytics Reports to Revolutionize Your Marketing Strategy
Leveraging the capabilities of Google Analytics 4 (GA4) is crucial for making data-driven decisions that shape marketing strategies based on audience behavior. Many new users may find GA4's interface and terminology overwhelming, but do not let that deter you. As you build a solid grasp of GA4, you will unlock insights that significantly enhance your understanding of customer interactions. Mastering its features and analytics will provide you with invaluable data regarding your customer base, enabling you to refine and optimize your marketing initiatives. Let’s explore five vital GA4 reports that can substantially elevate your marketing strategies and results.

1. Traffic Acquisition Report: Identify Key Sources Fueling Your Website Traffic
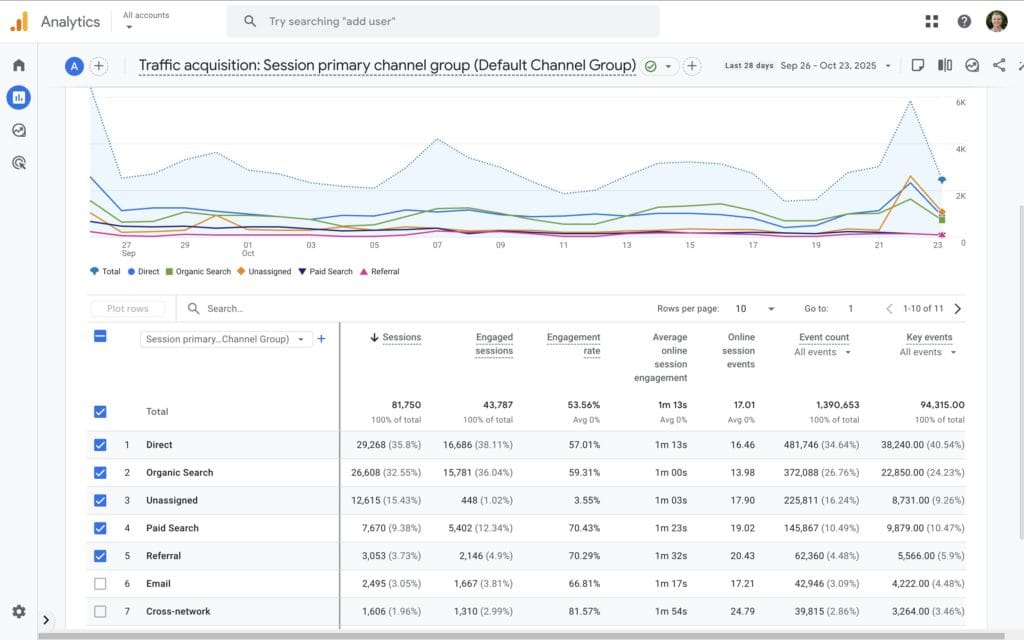
Have you ever wondered where your website traffic originates? The Traffic Acquisition report is your gateway to uncovering this critical information. This insightful report categorizes the various channels that drive visitors to your site, allowing you to pinpoint essential marketing avenues—such as organic search, paid advertising, social media, and referrals. By thoroughly analyzing these channels, you will gain a comprehensive understanding of your audience's origins, enabling you to strategically focus your marketing efforts for maximum impact.
Maximize the Traffic Acquisition Report for Your Marketing Strategy:
- Identify Your High-Performing Channels: Examine which platforms are delivering the highest volume of visitors to your site. If you discover that organic search is leading, consider amplifying your investment in SEO efforts to capitalize on this success.
- Evaluate Traffic Quality: Focus not only on the quantity of traffic but also on metrics such as sessions per user and average engagement time to gain a clearer understanding of visitor interest and commitment.
- Optimize Your Marketing Budget: Allocate your marketing budget wisely to the channels that not only draw in visitors but also engage them effectively, ensuring they return.
Understanding the origins of your audience empowers you to shift your marketing focus toward the channels that yield the best results. The report automatically visualizes various pathways users take to access your website, but you can enhance its effectiveness by tagging your inbound marketing campaigns. This strategy is particularly vital when distributing newsletters or executing advertising campaigns aimed at driving traffic to your site.
Utilizing Campaign Tagging URLs for Enhanced Google Analytics Tracking
Campaign-tagged URLs are specially crafted links to your website that integrate additional tracking information, known as query parameters. These parameters enable Google Analytics to monitor your marketing endeavors with greater precision. By appending these parameters to your URLs, you unlock detailed insights into how visitors arrive at your site, providing data that goes beyond standard reports.
The Importance of Campaign Tagging URLs in Your Analytics Strategy:
- Track Specific Marketing Campaigns: These URLs empower you to pinpoint which specific marketing campaigns are successfully driving traffic to your website.
- Clarify Your Traffic Sources: Gain insights into where your visitors originate, whether from a newsletter, a social media post, or a paid advertisement.
- Measure Campaign Effectiveness: By analyzing data from tagged URLs, you can identify your most successful campaigns and refine your strategy accordingly.
How Do Campaign Tagging URLs Enhance Acquisition Reports?
Google Analytics typically categorizes traffic sources into organic search, direct, referral, and organic social. While this provides a foundational understanding, it lacks the granularity needed to gain insights into specific campaigns or links.
Steps to Implement Campaign Tagging in Your URLs:
To effectively utilize campaign-tagged URLs, you must append specific parameters to your inbound links. Key parameters include:
- utm_source – identifies the source of your traffic, such as a newsletter, Facebook, or Google.
- utm_medium – specifies the marketing medium, whether it be email, social media, or cost-per-click (CPC).
- utm_campaign – denotes the specific campaign name, like ‘spring sale' or ‘product launch'.
- utm_term (optional) – primarily used for paid search campaigns to identify specific keywords.
- utm_content (optional) – differentiates similar content or links within the same advertisement or campaign.
For example, here is a Tagged URL:
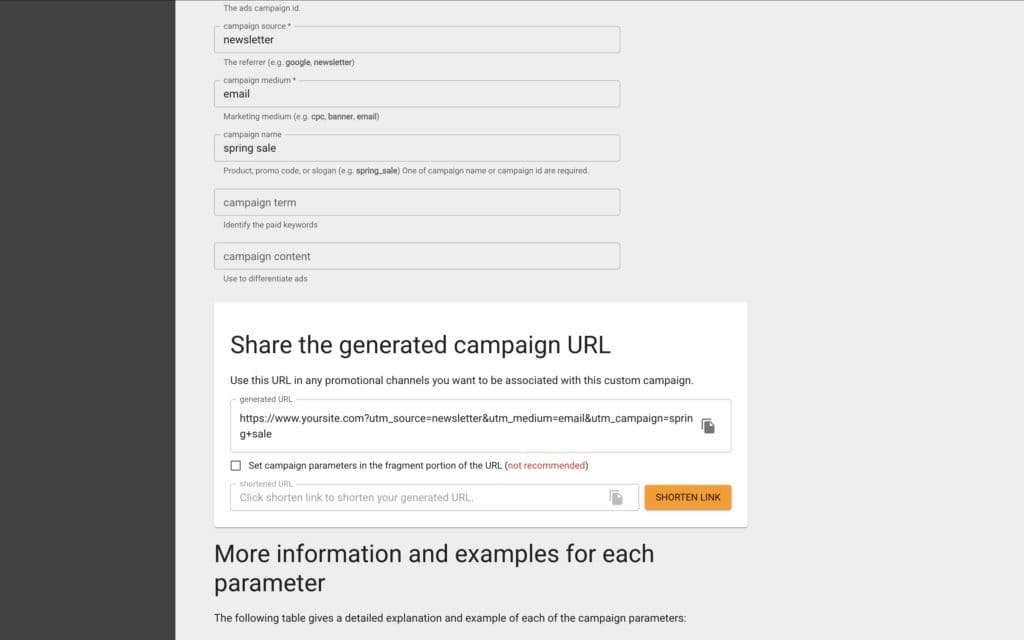
When a user clicks on this link, Google Analytics captures the parameters, allowing you to identify that the visitor came from your “spring sale” campaign via an email newsletter. By adjusting your inbound links with campaign tags, you can accurately track how users discover your website.
In addition to creating campaign-tagged URLs, linking your Google Ads account with Google Analytics is also highly beneficial. Doing so allows you to visualize a more comprehensive overview of your marketing performance. You can view a tutorial video to guide you through this process:
2. Engagement Reports: Analyze User Interaction on Your Website for Better Insights
Attracting traffic to your site is only one aspect of the marketing equation. The Engagement Reports provide vital insights into the actions visitors take once they arrive. Are they lingering and exploring, or do they exit soon? Which pages hold their attention the longest?
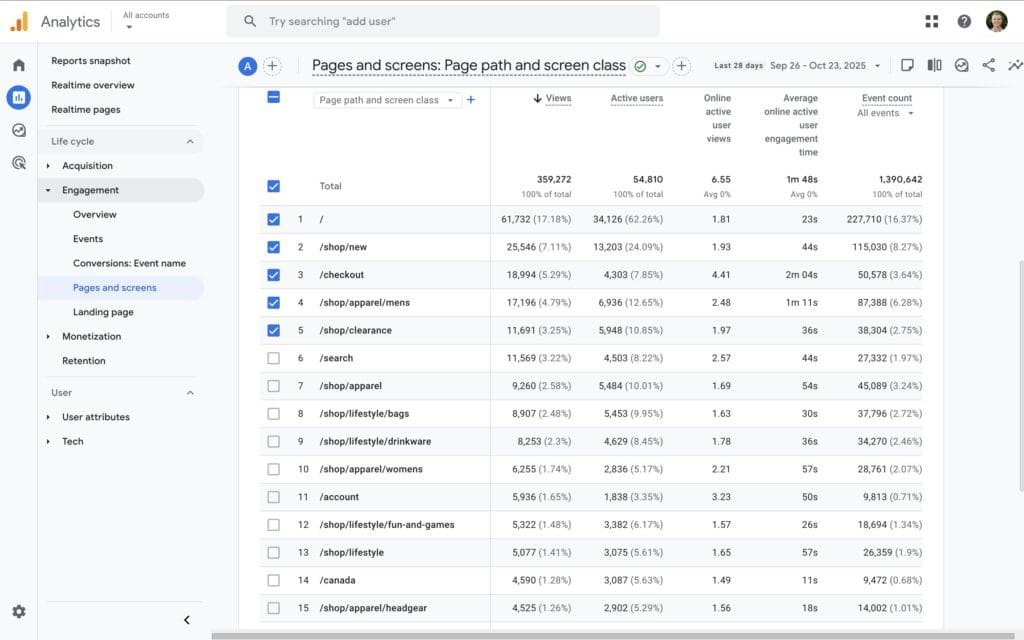
Within the Engagement section, the Pages and Screens report outlines all the pages users have engaged with on your website. This report allows you to identify your most and least engaging content. Key metrics to monitor include:
- Views: The total number of times your pages have been accessed, helping you quickly identify which content resonates strongly with users.
- Views Per Active User: This metric helps you understand which content users revisit, indicating high interest or perceived value.
- Key Events: Monitor actions on specific pages, such as purchases, sign-ups, or other conversions. Setting up key events allows you to evaluate how effectively particular pages drive user actions and align with your business objectives.
Utilize Engagement Insights to Enhance Your Website Effectively:
- Enhance High-Performing Content: If certain blog posts or product pages generate substantial engagement, consider producing more similar content to maintain that interest and drive further traffic.
- Improve Low-Engagement Pages: Identify pages with high bounce rates and make strategic adjustments to boost engagement, such as implementing clearer calls to action or more captivating visuals.
- Personalize User Experience: Ensure that navigation is intuitive and content is relevant to keep visitors exploring your website for longer durations.
Prioritizing user engagement is essential; your objective should not merely be to increase page views, but to cultivate relationships that convert visitors into valuable leads and loyal customers for your business.
3. Funnel Exploration Report: Strategically Optimize User Journeys for Better Conversions
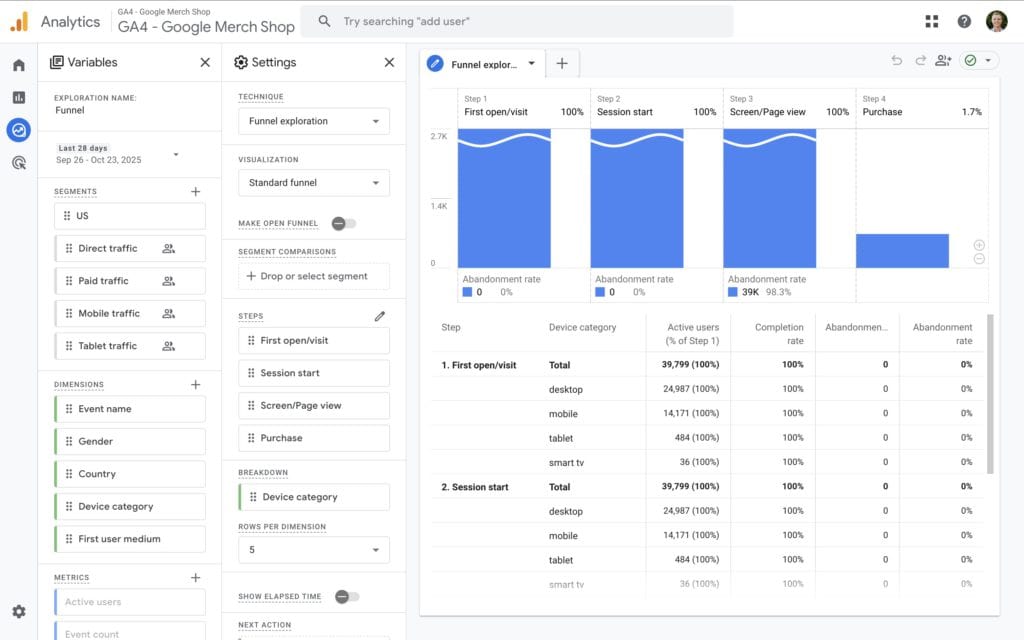
Understanding how users navigate through your website is crucial for enhancing conversion rates. The Funnel Exploration report in GA4 enables you to visualize the steps users take toward achieving specific goals, such as completing a purchase or signing up for a newsletter. This report helps identify where users drop off in the conversion process, offering insights to optimize each stage and improve the overall user experience.
Steps to Create an Effective Funnel Exploration Report in GA4:
Step 1: Set Up the Report
- Navigate to the ‘Explore’ section.
- Click ‘Blank’ to initiate a new report.
- Select ‘Funnel Exploration’ from the drop-down menu under ‘Technique’.
Step 2: Define Your Funnel Steps
- Click the pencil icon next to ‘Steps’ to outline your funnel.
- Add a step for each stage in your user journey and assign it a clear name (e.g., ‘Visited Homepage’, ‘Viewed Product’, ‘Added to Cart’, ‘Completed Purchase’).
- For each step, select the event or page view that corresponds to that action.
For example:
- Visited Homepage: Event name equals ‘page_view’ where page path equals ‘/’.
- Viewed Product: Event name equals ‘view_item’.
- Added to Cart: Event name equals ‘add_to_cart’.
- Completed Purchase: Event name equals ‘purchase’.
- After defining all steps, click ‘Apply’.
Step 3: Customize Your Funnel (Optional)
- Decide whether you want an ‘Open Funnel,’ allowing users to enter at any step, or a ‘Closed Funnel,’ where users must start at the beginning.
- Set an optional timeframe for how long users have to complete the funnel.
- Add filters to focus on specific user criteria if necessary.
Maximize the Benefits of Your Funnel Exploration Report:
- Optimize Conversion Steps: Assess each funnel stage to uncover opportunities for improvement. If a significant number of users exit during a specific step, consider simplifying the process or providing additional guidance.
- Enhancing User Experience: Utilize insights from the funnel report to create a more intuitive user journey. This may involve redesigning pages, improving load times, or refining calls to action to better meet user needs.
- Testing and Iterating: Conduct A/B tests across funnel stages to identify which changes lead to higher conversion rates. Continuous testing helps refine your processes over time for better results.
- Personalizing Content: Tailor the user experience based on segment behavior. For instance, if mobile users drop off at a particular step, optimize that stage specifically for mobile devices.
Utilizing the Funnel Exploration report enables you to create a more streamlined and effective pathway to conversion. By identifying and addressing weaknesses within your funnels, you can enhance the process and effectively guide users toward your desired outcomes.
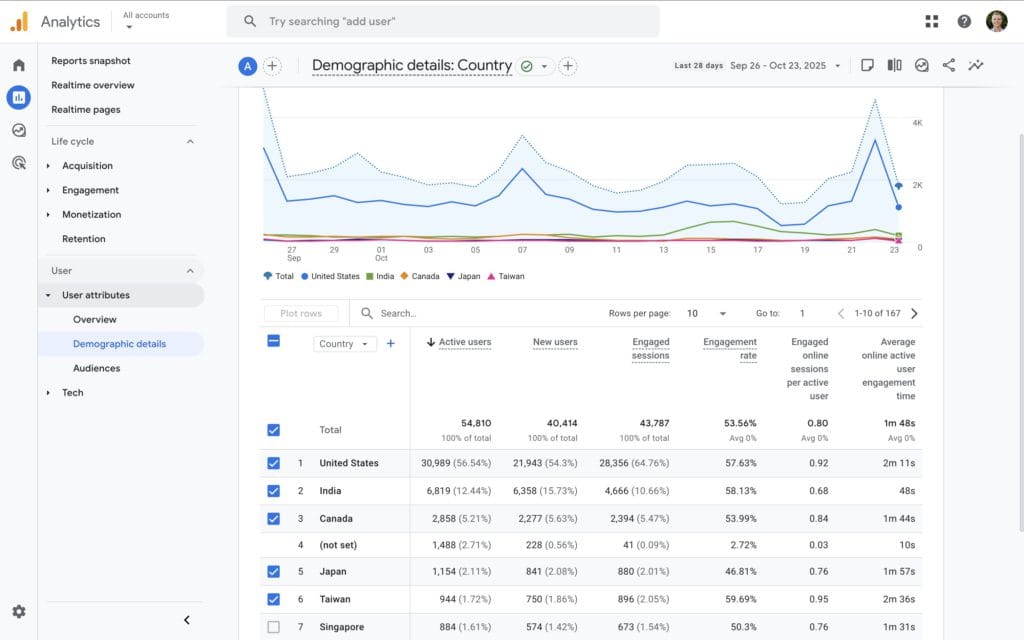
4. Demographic Insights Report: Gain Comprehensive Understanding of Your Audience
The Demographic Details report offers invaluable insights into your audience's age, gender, location, and interests. This information is crucial for customizing your content and campaigns to better resonate with your target audience, ultimately driving increased engagement and conversions.
Key Areas of Focus in the Demographic Report:
- Age and Gender Analysis: Discover the age ranges and gender distribution of your audience to tailor your messaging and content effectively.
- Geographic Distribution: Identify the locations of your users to enhance regional marketing efforts and strategically time your campaigns for maximum impact.
- Interests and Affinity Categories: Understand your users' interests beyond your website to create captivating and engaging content that draws their attention.
Effective Strategies Derived from Demographic Insights:
- Personalize Your Content: Develop content and marketing messages that align seamlessly with the preferences of your primary demographic segments for greater resonance.
- Implement Targeted Advertising: Leverage demographic data to refine your ad targeting, ensuring your promotions reach the most receptive audience segments.
- Expand Your Market Reach: Identify underrepresented demographics that offer growth potential and strategize ways to engage these prospective users effectively.
By focusing on demographic insights, you can craft marketing campaigns that are more relevant and effective, connecting with your audience’s specific needs and preferences, thereby driving better results.
5. Monetization Insights Report: Gain Clarity on Your Revenue Streams
For websites generating revenue, the Monetization reports are invaluable tools. These reports provide a comprehensive overview of how users contribute to your financial success, allowing you to make informed, strategic decisions based on data.
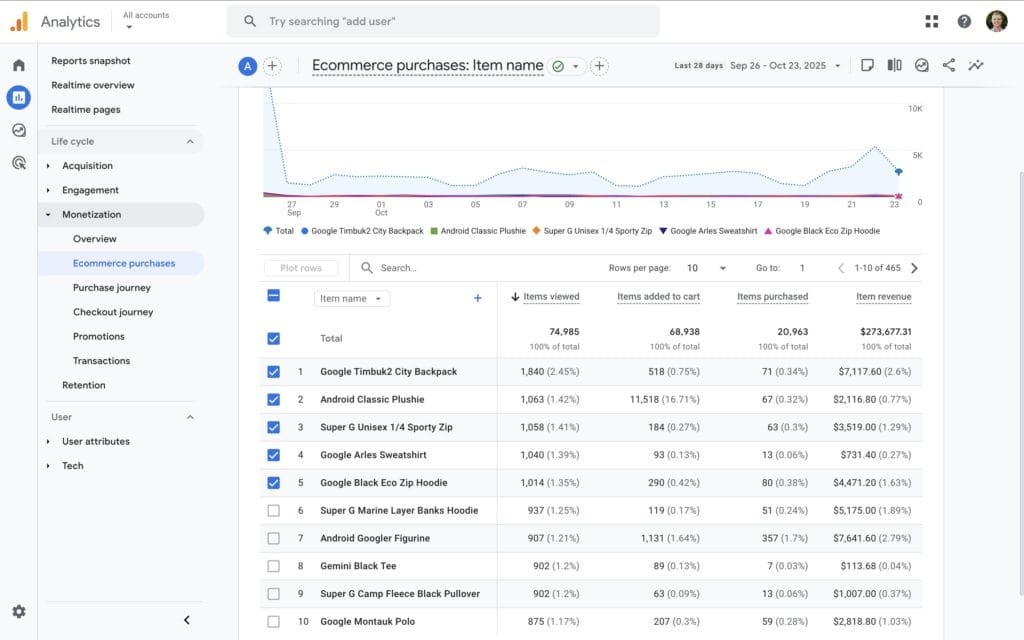
Essential Metrics to Monitor for Sustained Financial Success:
- Total Revenue: The cumulative income generated over a specific period, giving you a clear view of your financial performance.
- Average Purchase Revenue: The average revenue generated per transaction, assisting in assessing overall profitability.
- Purchases: Track the frequency and types of products or services sold to understand customer preferences and trends.
Utilize This Data to Boost Your Revenue Streams:
- Identify Your Best-Selling Products: Direct your marketing efforts toward products that generate the highest revenue and engagement.
- Enhance Product Promotion: Elevate the visibility and appeal of your products to drive sales and revenue.
- Leverage Upselling and Cross-Selling Opportunities: Use purchasing data to recommend complementary products, thereby increasing the average order value and overall profitability.
A thorough understanding of your monetization metrics empowers you to make informed decisions that enhance profitability and overall business growth, ensuring long-term success.
Take Action Now to Master Google Analytics and Transform Your Marketing Strategies
By familiarizing yourself with these five essential GA4 reports, you are establishing a strong foundation for marketing success driven by data-informed insights. To deepen your expertise in Google Analytics, consider enrolling in a Google Analytics 4 Course to learn how to leverage these reports effectively and maximize the potential of this crucial business tool.
Remember, successful marketing is not solely about attracting visitors; it is equally about understanding their needs and behaviors. Utilize the reports discussed here to gain deeper insights into your audience, refine your strategies, and watch your marketing initiatives thrive and succeed.
The post 5 Google Analytics Reports Every Marketer Should Know About appeared first on Ezi Gold.
The Article Essential Google Analytics Reports Every Marketer Needs Was Found On https://limitsofstrategy.com


No responses yet